Acid Rain Lesson Student Worksheet
What is acid rain?
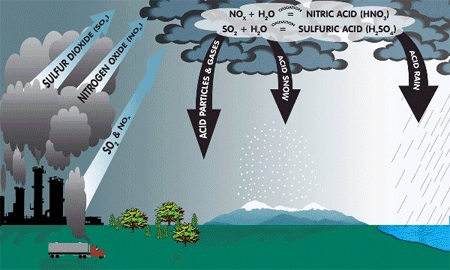
Acid Rain is a term used to describe the phenomena of rainfall that contains lower than normal readings of pH due to inputs of sulfur dioxide and nitrogen oxide compounds into the atmosphere. These compounds come from power plants and other industries that burn fossil fuels for energy. Scientists are concerned about acid rain and its impact on the environment. For this lesson we will focus specifically on the affects of acid rain on lakes and aquatic life although acid rain's impacts are much broader.
How Acidic is Rain in New York State?
A pH scale is used to measure acidity, with 0 being the most acidic and 14 the most alkaline. A value of 7 is neutral. Solutions with a pH of less than 7 are acids, while those with a pH greater than 7 are bases. A decrease in pH represents an increase in acidity, and an increase in pH represents a decrease in acidity. The scale also is logarithmic, meaning that a one-unit change actually represents a tenfold change. Rainfall is somewhat acidic by nature, due to atmospheric carbon dioxide (gas) reacting with precipitation (rain drops) to make carbonic acid, a weak acid. The acidity of rainfall is critical for the weathering of rocks and formation of soils on land. Without it there would not be the needed minerals and nutrients in soils to grow plants. However, acid rain is intensifying this weathering process and can have negative impacts on the landscape and surface waters where transported ions and sediments end up. While normal rainfall is slightly acidic (about 5.5) the average pH of rainfall in New York State ranges from 4.0 to 4.5 - 30 times more acidic than "normal". Below is a graph that illustrates the acid rain cycle.
Acid Rain and the Environment
When acid rain falls to the earth it interacts with landscape features which affects how it will impact the environment. Much of the research on the detrimental effects of acid rain has been conducted in the Adirondack region of New York State where the igneous/metamorphic bedrock in this region and the thin, slightly acidic soils lack the ability to neutralize the inputs from acid rain. In the Finger Lakes region however, calcareous soils and limestone outcrops which contain Ca CO 3 (calcium carbonate) are dominant in the landscape and provide a "buffer" against acid rain. Source: Lajewski, C. K. et. al. Geological Society Bulletin 2003.
Below are links to bedrock maps of the regions discussed:
Acid rain has many negative impacts on the environment. Acid rain can alter the pH of surface water such as lakes and streams stressing aquatic life that is adapted to certain pH levels. Acid rain also can erode to concrete buildings and monuments. And the particles in acid rain can contribute to health problems for people with respiratory illness like asthma or bronchitis.
Below are links that provide some good background information about water quality and pH and the impacts of acid rain. You may ask students to do some of their own research as well.
Glossary of Terms
pH and Water Quality
What is Acid Rain?
Acid Rain Impacts on the Environment
Lesson Outcomes
Through this lesson and accompanying activity students will:
- Understand the dynamics of acid rain and its impact on the living and non-living environment.
- Hypothesize how acid rain affects water pH levels in two lake systems with differing watershed features.
- Learn to make scatter plot charts of data sets using MS Excel computer software.
- Analyze trends in charts.
- Interpret data from charts and table.
MST Standards
- Standard 1 Key 1, Key 3
- Standard 2 Key 1
- Standard 4 Key 2, Key 6
- Standard 5 Key 3, Key 6
Lesson Objectives
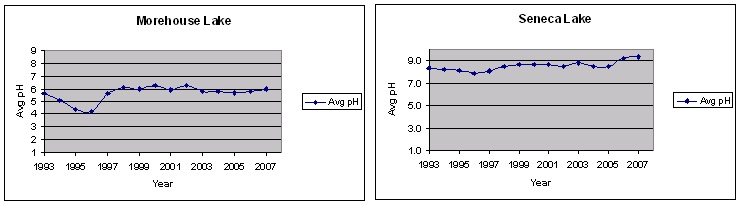
In this lesson you will be investigating the relationship between acid rain and pH levels in two lakes: Morehouse Lake in the Adirondacks and Seneca Lake in the Finger Lakes. To do this you will be using data on pH levels collected from both lakes for the years 1993-2007 and making two charts. You will be using these charts along with the charts provided in the lesson to answer the questions A-E. Although the charts will help you to answer some of the questions you will need to refer to the website links found at the bottom of the page for further information. At the end of this lesson you should have completed:
- Two charts: Avg pH in Morehouse Lake; Avg pH Seneca Lake
- Answered questions A-E using your generated charts, the charts and table provided and the website links as references.
Activity
In this activity you will make two charts showing a line graph of the average pH concentrations in the surface waters of a lake in the Adirondacks - Morehouse Lake, and for a lake in the Finger Lakes region - Seneca Lake, for the years 1993-2007. Follow the steps below to complete the activity.
Step 1) Copy and paste to copy the data sets (including the headers) shown here into an Excel file.
Data
Morehouse and Seneca lakes data
Activity for Users of Excel Before 2007
Activity for Users of Excel Version 2007
The two charts that students generate should look like this:
Answer the questions below. Additional information can be found at the websites listed.
A. What is the general trend of the pH levels in the lakes over the past ten years?
The general trend has been for the pH levels to increase. The magnitude of these increases may not seem apparent to the students when they view the charts and see only a unit increase in pH levels from one year to the next. Remind students however that the increase in pH from one unit to the next is logarithmic or exponential. The articles enphasize that scientists are claiming the increase in pH levels are apparent but may not keep going up if there are not more restrictions placed on emissions from power plants and vehicles.
B. How would you explain this trend?
The increase in pH values over the past ten years has been linked to the Amendments to the Clean Air Act of 1990. Although scientists agree that the 1990 Amendments have helped reduce the impacts of sulfur dioxide emissions, they are unclear whether the Amendments have had as great an impact on Nitrogen Oxide emissions. Scientists from Syracuse University and the University of Maine caution that further reductions in emissions may be needed to bring the lakes in the Northeast back to health.
C. Which lake system has a greater potential to buffer the effects of acid rain and why?
Recent research conducted by scientists from Syracuse University has shown that the soils and underlying bedrock in the Finger Lakes region buffer the effects of acid rain and actually contribute to an "alkalization" of the lakes. Scientists call this phenomena a "chemical weathering" of the bedrock in the region which increased rapidly in the 1820s when the region was deforested, leveling off and then beginning again after World War II and into the 1990s. See links below for the actual study and the a synthesis of the study for the student handout.
Lajewski Study of Finger Lakes and Acid Rain
Acid Rain in the Finger Lakes
Acid Rain in the Adirondacks
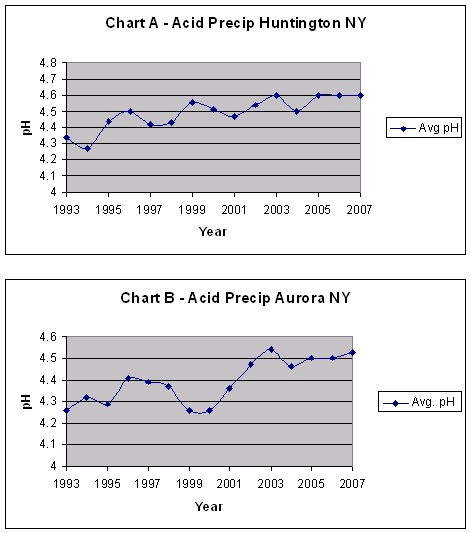
D. Charts A & B show the annual average pH of rainfall at a monitoring site in Huntington NY (Adirondacks) and Aurora NY (Finger Lakes) over the past ten years.
- What trend do you see in these charts?
- For each region acid rain precipitation shows an increase in pH levels.
- Explain the possible reasons for this trend.
- The reductions of sulfur emissions due to the Clean Air Act Amendments of 1990 which reduced the amount of sulfur dioxide into the atmosphere reducing the amount of sulfur in acid rain.
- Are there differences or similarities between acid precipitation in the Adirondacks and the Finger Lakes?
- The data show the most obvious upward trends for both regions. In the 1990's the pH levels of the acid rain were actually lower in the Finger Lakes region than in the Adirondacks. Students are then asked to observe why then would we see lower pH levels in Morehouse Lake in the Adirondacks vs. Seneca Lake during this period of time?
- Using the charts you just generated on Morehouse and Seneca Lakes explain how acid rain precipitation in both regions impacts pH levels in the lakes.
- As the pH levels in the acid precipitation have increased for both regions, the pH levels in the lakes reflect this trend with higher pH levels in the surface waters.
- Why are there differences in how the acid rain precipitation affects the pH levels in Morehouse Lake vs. Seneca Lake?
- When acid precipitation falls in the Adirondacks the soils and bedrock lack the ability to buffer the effects of the acids. Morehouse Lake is also more acidic to begin with so the pH levels have remained acidic. However, in the Finger Lakes region the limestone bedrock and calcareous soils are able to buffer the effects of acid rain by the chemical weathering of calcium carbonate and the pH levels of the lake have remained basic.
-
- During the years 1993-1999 what would the health level of aquatic life have been in Morehouse Lake and how would this have affected aquatic life found in the lake?
- 1993-1999 were critical years for Morehouse Lake as pH levels dipped to 4.0 at one point before going back up to 6.0. The health level of the lake was at an all time low of 4 where insects and frogs and some fish may have been affected. Fish eggs would not have hatched.
- How does the health level of Seneca Lake compare to Morehouse Lake? Seneca Lake pH levels were at or slightly above 8.0 during this time period so the health level of the lake would have been 7 or optimal. Species of fish and other aquatic life would not be affected by the pH levels.
E. Using the charts you made on pH levels in Seneca Lake and Morehouse Lake and the table below answer the following questions about the health of the water body if pH is the only factor.
-
pH and Effect on Aquatic Organisms
Health Level
pH
Effect
1
3.0 - 3.5
Unlikely that fish can survive for more than a few hours in this range.
2
3.5-4.0
Known to be lethal to salmon species.
3
4.0-4.5
All fish, most frogs, and insects are absent.
4
4.5-5.0
Mayfly and many other insects absent. Most fish eggs will not hatch.
5
5.0-5.5
Bottom dwelling bacteria (decomposers) begin to die. Leaf litter and detritus begin to accumulate, locking up essential nutrients and interrupting chemical cycling. Plankton begin to disappear. Snails and clams absent. Mats of fungi begin to replace bacteria in the substrate. Metals (aluminum, lead) normally trapped in sediments are released in the acidified water, which are toxic to aquatic life.
6
6.0-6.5
Freshwater shrimp absent. Unlikely to be directly harmful to fish.
7
6.5-8.2
Optimal range for most organisms.
8
8.2-9.0
Unlikely to be directly harmful to fish. Indirect effects could occur due to chemical changes of the water.
9
9.0-10.5
Likely to be harmful to salmon species and perch if level persists.
10
10.5-11.0
Rapidly lethal to salmon species. Prolonged exposure is lethal to species such as carp and perch.
11
11.0-11.5
Lethal to all species of fish.
Source: Center for Earth and Environmental Science at Indiana University - Purdue University Indianapolis.
Bonus Question:
Hypothesize and explain two factors that may cause a body of water to change pH.
pH levels are also affected by photosynthesis and respiration of plant life in the lakes. During photosynthesis plants take up CO2 which causes the pH levels to increase,at night when plants are respiring the pH levels will naturally decrease as CO2 is released. Episodic acidification is also possible when there is a sudden snow melt or rainfall releasing acidic pollutants into watersheds. Other factors that will affect pH are the release of chemicals from industrial pollution and vehicle emissions.Link to other lesson plans on pH
- During the years 1993-1999 what would the health level of aquatic life have been in Morehouse Lake and how would this have affected aquatic life found in the lake?